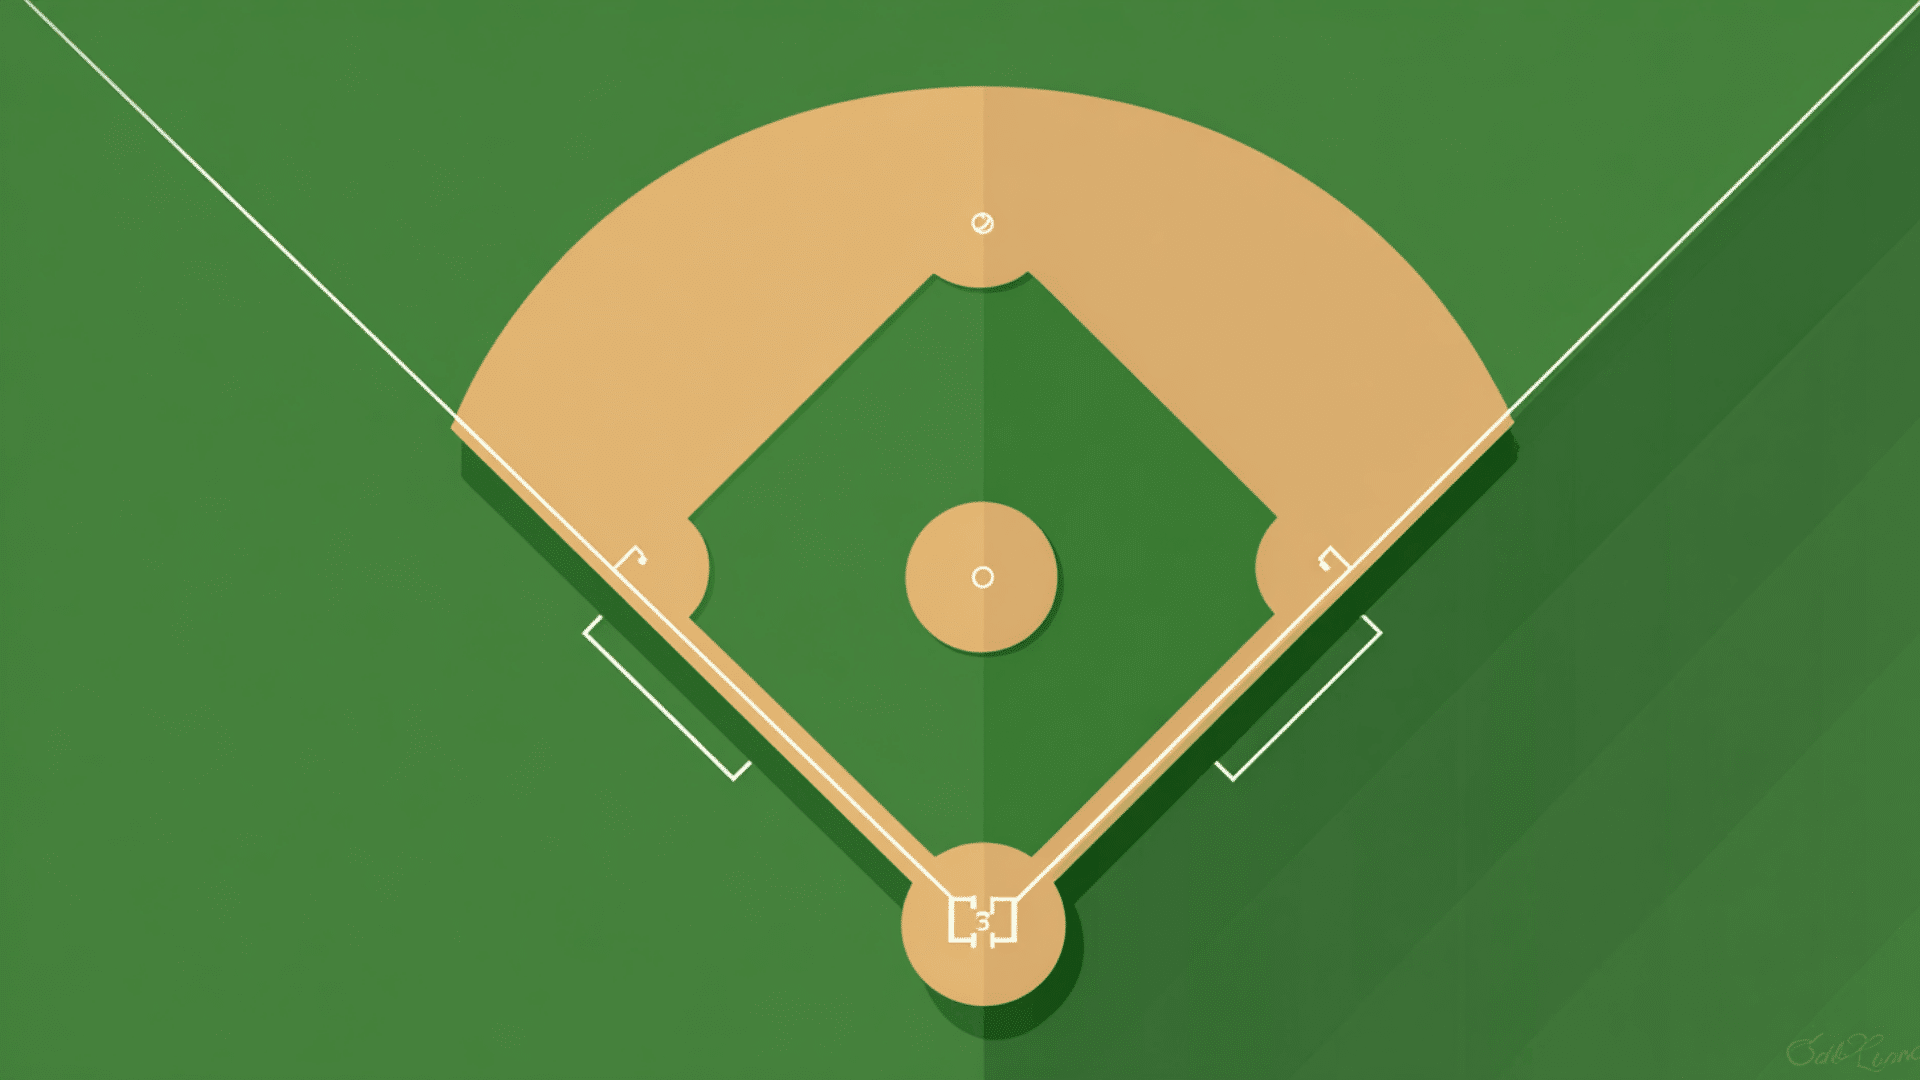

Baseball has plenty of numbers, from batting averages to earned run averages. If you are new to the sport, these statistics can seem confusing. However, understanding baseball stats becomes easier once you know what each number measures.
These numbers help fans compare players, track team performance, and understand decisions made during games. Coaches also use statistics to evaluate players and plan their lineups.
Baseball statistics generally fall into four categories: hitting, pitching, fielding, and advanced metrics. Each category explains a different part of the game.
This blog explains the most common baseball stats, their meanings, useful benchmarks, and how to read player performance.
Quick Reference Chart
This table covers some common baseball abbreviations and what they measure. You can use it while checking player profiles or watching a game.
|
Stat |
Full Form |
What It Measures |
|---|---|---|
|
AVG |
Batting Average |
Hits per at-bat |
|
RBI |
Runs Batted In |
Runs credited to a batter |
|
HR |
Home Runs |
Balls hit out of the playing field in fair territory or inside-the-park home runs |
|
OBP |
On-Base Percentage |
How often a batter reaches base |
|
OPS |
On-Base Plus Slugging |
Combined on-base and power production |
|
SB |
Stolen Bases |
Successful base-stealing attempts |
|
ERA |
Earned Run Average |
Earned runs allowed per nine innings |
|
K |
Strikeouts |
Batters retired by strikeout |
|
WHIP |
Walks and Hits per Inning Pitched |
Hits and walks allowed per inning |
|
W-L |
Wins-Losses |
Pitcher decisions |
|
SV |
Saves |
Qualifying relief appearances that finish a win |
|
FPCT |
Fielding Percentage |
Successful fielding chances |
|
E |
Errors |
Officially scored fielding mistakes |
|
WAR |
Wins Above Replacement |
Estimated value above a replacement-level player |
Note: The ranges in this article are rules of thumb for MLB players, set against recent league averages. They shift by season, league, position, and ballpark, so a number that is strong for one player may be less impressive for another.
Basic Hitting Stats Explained
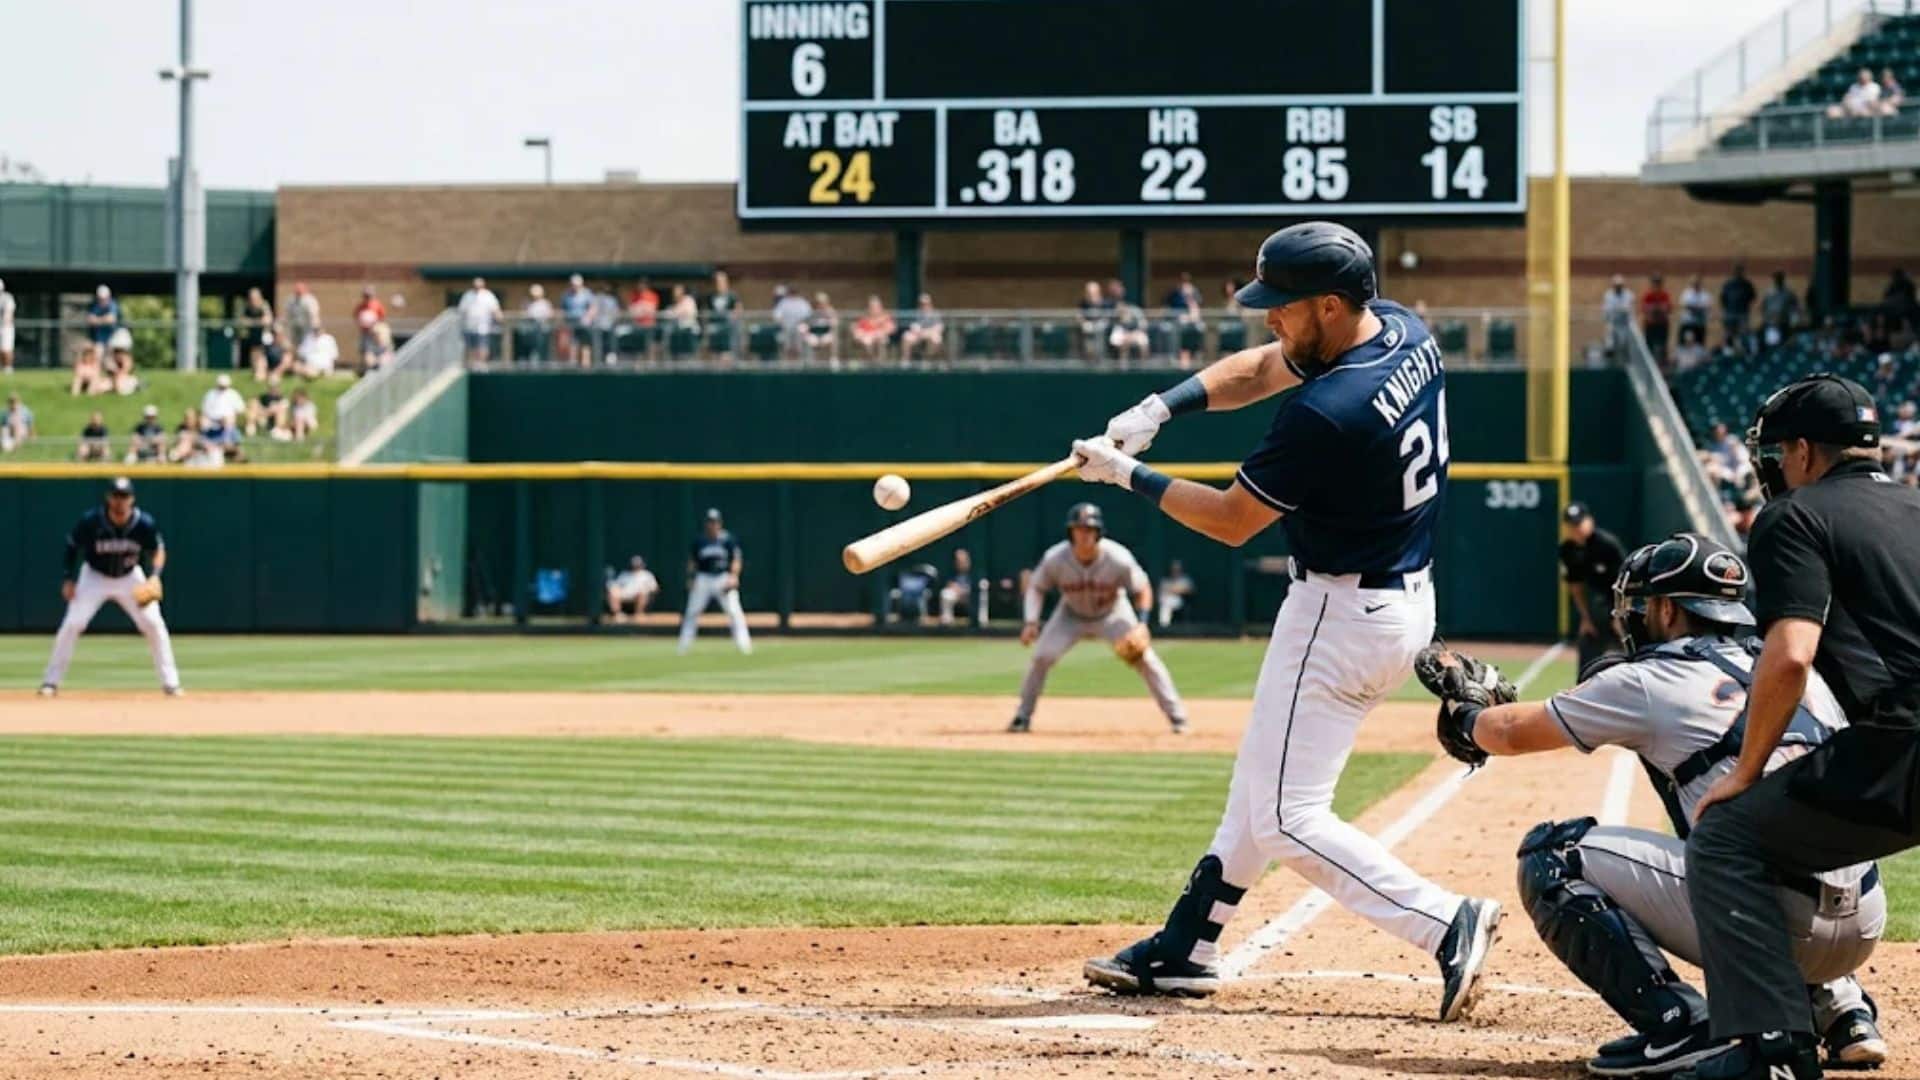
Hitting statistics measure a batter’s performance at the plate. They help explain how often players get hits, reach base, and contribute to their team’s scoring.
1. At-Bats (AB) and Plate Appearances (PA)
At-bats and plate appearances measure a batter’s opportunities at the plate, but they are not the same.
An at-bat (AB) counts most completed batting appearances. Walks, hit-by-pitches, sacrifice bunts, and sacrifice flies do not count as at-bats.
A plate appearance (PA) includes every completed turn at the plate, regardless of the result.
Example: If a player gets two hits, draws one walk, and hits one sacrifice fly, they record four plate appearances but only two at-bats.
This difference matters because batting average uses at-bats, while on-base percentage uses a broader set of qualifying opportunities.
2. Batting Average (AVG)
Batting average measures how frequently a batter gets a hit. It compares the number of hits with the number of official at-bats.
Formula: Batting Average = Hits ÷ At-Bats
For example, a player with 30 hits in 100 at-bats has a .300 batting average. This means the player gets a hit in 30% of their at-bats.
|
Batting Average |
General Interpretation |
|---|---|
|
.300 or higher |
Excellent |
|
.270–.299 |
Strong |
|
Around .250 |
Near the recent MLB league average |
|
Below .230 |
Generally low |
These are general guidelines rather than fixed standards. League-wide averages change over time, and a player’s position and role also matter.
A .300 batting average has traditionally been considered an excellent achievement. However, batting average does not count walks or distinguish between singles and home runs. Other statistics provide that information.
3. Runs Batted In (RBI)
Runs Batted In (RBI) counts the runs credited to a batter when their offensive action helps a teammate score.
For example, imagine a runner is standing on second base. The batter hits a single, allowing that runner to reach home. The batter receives one RBI.
A batter can also earn an RBI through a sacrifice fly and certain other qualifying plays. However, a run scored because of a fielding error or certain double plays does not count as an RBI.
General full-season reference:
-
80–100 RBIs: Productive run production.
-
100 or more RBIs: Strong run production.
RBI totals also depend on how often teammates reach base. Therefore, this statistic should not be used alone to judge a hitter’s ability.
4. Home Runs (HR)
Home runs are among the most recognizable statistics in baseball. A batter earns a home run when they hit a fair ball that allows them to circle all four bases and score without being put out.
A ball that clears the outfield fence in fair territory is an automatic home run. Inside-the-park home runs can also happen when the ball stays in play, and the batter reaches home safely.
General full-season reference:
-
20 or more home runs: Meaningful power production.
-
30 or more home runs: Strong power season.
-
40 or more home runs: Exceptional power season.
Home run totals depend on playing time, ballpark conditions, and the offensive environment of the season.
5. On-Base Percentage (OBP)
On-base percentage measures how frequently a batter reaches base safely. It includes hits, walks, and times a batter is hit by a pitch. Unlike batting average, OBP recognizes that players can reach base without getting a hit.
Formula: OBP = (Hits + Walks + Hit by Pitches) ÷ (At-Bats + Walks + Hit by Pitches + Sacrifice Flies)
For example, a player with 40 hits, 10 walks, and 2 hit-by-pitches, along with 100 at-bats and 3 sacrifice flies, has an OBP of .452.
A higher OBP generally means the player reaches base more frequently. It can also reveal the value of a batter who draws walks regularly.
General reference: An OBP of .350 or higher is generally considered strong, although league conditions can change this benchmark.
6. Stolen Bases (SB)
A stolen base happens when a runner successfully advances to another base without the advance being credited to a hit, error, or another qualifying play.
Players usually attempt stolen bases by running while the pitcher delivers the ball toward home plate. Speed, timing, and awareness are important for successful attempts.
General full-season reference:
-
10 or more stolen bases: Some baserunning production.
-
20 or more stolen bases: Strong base-stealing production.
-
30 or more stolen bases: Excellent stolen-base production.
However, stolen bases should be considered alongside caught-stealing totals. A player who gets caught frequently may not provide as much value as their stolen-base total suggests.
Pitching Stats You Need to Know
Pitching statistics show how effectively pitchers prevent runs, retire batters, and limit opposing teams’ scoring opportunities.
1. Earned Run Average (ERA)
ERA measures how many earned runs a pitcher allows per nine innings. An earned run is a run charged to a pitcher that scores without being the result of a fielding error or passed ball.
Formula: ERA = (Earned Runs × 9) ÷ Innings Pitched
For example, a pitcher allows 10 earned runs over 30 innings.
ERA = (10 × 9) ÷ 30 = 3.00
This means the pitcher allows an average of three earned runs per nine innings. Stat pages write partial innings as .1 and .2, so 6.2 innings means six and two-thirds innings, not 6.2. Convert partial innings before you use the formula.
|
ERA |
General Interpretation |
|---|---|
|
Below 2.50 |
Excellent |
|
2.50–3.50 |
Strong |
|
3.50–4.00 |
Around a reasonable range |
|
Above 4.50 |
Generally high |
These ranges are only rough guidelines. ERA varies with the season, league, and ballpark.
2. Strikeouts (K)
A strikeout occurs when a batter is retired after receiving a third strike. This can happen through swinging strikes, called strikes, or a foul bunt with two strikes. Strikeouts are important because the batter is retired without putting the ball into play for a fielder to handle.
How it is measured: Pitchers receive one strikeout for each batter they retire by strikeout.
General full-season reference:
-
150 strikeouts: A substantial total for many pitchers.
-
200 or more strikeouts: A strong season for a starting pitcher.
Strikeout totals depend on innings pitched and the pitcher’s role. A starting pitcher generally has more opportunities to record strikeouts than a relief pitcher.
3. Wins and Losses (W-L)
The wins-losses record shows how many decisions are officially credited to a pitcher.
A pitcher receives a win or loss under specific scoring rules. For example, a starting pitcher generally must complete at least five innings to qualify for a win in a game of at least five innings, although relief pitchers can also receive wins.
However, this statistic can be misleading. A pitcher can perform well but lose because their team does not score enough runs. Another pitcher may receive a win with considerable help from teammates.
For this reason, wins and losses should be considered alongside ERA, WHIP, and other pitching statistics.
4. Saves (SV)
A save is credited to a relief pitcher who finishes a game won by their team while meeting at least one qualifying condition. These conditions include:
-
Entering the game with a lead of three runs or fewer and pitching at least one inning.
-
Entering with the potential tying run on base, at bat, or on deck.
-
Pitching at least three innings to finish the game.
A pitcher cannot receive a save if they are credited with the win.
General full-season reference: A closer with 30 or more saves has usually recorded a strong season. However, opportunities depend on how frequently the team has close leads.
Fielding Stats Made Simple
Fielding statistics measure a player’s defensive performance. They track how often fielders handle opportunities successfully and how frequently official scoring records an error.
1. Fielding Percentage (FPCT)
Fielding percentage measures how often a player successfully handles fielding chances without committing an error.
Formula: Fielding Percentage = (Putouts + Assists) ÷ (Putouts + Assists + Errors)
For example, suppose a player records:
-
90 putouts
-
60 assists
-
10 errors
Their fielding percentage is: 150 ÷ 160 = .938
This means the player successfully completed 93.8% of their recorded fielding chances.
A higher fielding percentage generally indicates fewer errors. However, it does not measure how much ground a player covers or how difficult their defensive plays are.
2. Errors (E)
An error is an official scoring decision assigned when a fielder makes a misplay that allows a batter or runner to advance, or allows a batter to reach base, when an ordinary effort should have produced an out or prevented the advancement.
Common examples include:
-
Dropping a routine fly ball.
-
Making an inaccurate throw that allows a runner to advance.
-
Failing to handle a ground ball that should have resulted in an out.
How it is measured: Each officially scored error is recorded in the player’s defensive statistics.
There is no fixed number of errors that makes a player good or bad. Position, playing time, and the number of defensive opportunities all matter.
A player with fewer errors may still have limitations in defensive range. Therefore, errors and fielding percentage do not tell the entire defensive story.
Advanced Baseball Stats
Advanced baseball statistics provide more context than traditional numbers. They help analysts evaluate performance by considering factors that basic statistics may overlook. These measurements are often associated with sabermetrics, the statistical analysis of baseball.
1. Wins Above Replacement (WAR)
Wins Above Replacement estimates how many additional wins a player contributes compared with a replacement-level player.
A replacement-level player is someone a team could reasonably find from available minor-league players or other readily available options.
WAR considers different parts of a player’s performance, including:
-
Batting
-
Baserunning
-
Fielding
-
Pitching
For example, a player with a WAR of 5.0 is estimated to contribute five more wins than a replacement-level player over the same period.
WAR helps compare players who perform different roles. However, calculations vary between statistical providers such as Baseball-Reference and FanGraphs.
2. Weighted On-Base Average (wOBA)
Weighted On-Base Average measures offensive performance by assigning different values to different ways of reaching base.
A home run receives more weight than a single because it creates more offensive value. Doubles, triples, walks, and hit-by-pitches also receive their own weights.
Unlike traditional on-base percentage, wOBA recognizes that not every way of reaching base contributes equally. This makes it useful for evaluating a hitter’s overall offensive contribution.
3. Weighted Runs Created Plus (wRC+)
Weighted Runs Created Plus measures a hitter’s offensive production while adjusting for league and ballpark conditions. Its scale uses 100 as the league-average benchmark.
|
wRC+ Value |
Meaning |
|---|---|
|
120 |
20% above league average |
|
100 |
League average |
|
80 |
20% below league average |
|
150 |
50% above league average |
For example, a player with a 120 wRC+ produces offensive value at a rate 20% above league average after the relevant adjustments. This statistic helps compare hitters who play in different ballparks or during different offensive environments.
4. Exit Velocity
Exit velocity measures how fast a baseball travels immediately after a batter makes contact. It is generally recorded in miles per hour (mph).
A higher exit velocity often indicates harder contact, which can increase the chances of extra-base hits. However, it does not guarantee a hit or home run.
5. Launch Angle
Launch angle measures the vertical angle at which a baseball leaves the bat after contact.
It helps explain the type of contact a batter makes.
-
Lower launch angles generally produce ground balls or line drives.
-
Higher launch angles can produce fly balls and pop-ups.
-
Certain combinations of exit velocity and launch angle create favorable conditions for extra-base hits and home runs.
Launch angle is most useful when considered alongside exit velocity rather than on its own.
How to Read a Player’s Stat Line
1. A Single-Game Box Score Line
A box score gives each hitter one row for that game. Most list AB, R (runs scored), H (hits), RBI, BB (walks), and strikeouts, shown as SO or K depending on the site.
A line of 4 AB, 1 R, 2 H, 1 RBI, 1 BB, 0 SO means the player came to the plate five times. They got two hits and a walk, scored once, and drove in one run.
The line score at the top of the box score shows each team’s runs by inning, followed by R, H, and E (errors) for the whole game.
2. A Full-Season Stat Line
Season stats work the same way across a full year. Yordan Alvarez of the Houston Astros hit .316/.432/.601 in 2026, with a 1.033 OPS and a 181 wRC+. In plain terms, he got a hit in nearly a third of his at-bats and reached base more than four times in every ten trips to the plate.
He also produced 81% more offense than a league-average hitter. He was also worth 6.8 WAR, third in the majors, even though he spent most of the season as a designated hitter.
Tips for Reading Baseball Stats Like a Pro
Understanding individual statistics is only the first step. You also need to know how to interpret them together.
Here are some practical ways to evaluate player performance:
-
Compare multiple statistics: Never judge a hitter using only batting average. Consider OBP and OPS too.
-
Consider ballpark effects: Some stadiums favor hitters, while others are more favorable to pitchers.
-
Check playing time: A player with fewer games has fewer opportunities to record hits, runs, and other counting statistics.
-
Look at defensive contributions: A player’s value can come from fielding and baserunning as well as hitting.
-
Consider sample size: A strong or poor performance over a few games does not necessarily represent a player’s ability over an entire season.
For example, consider two hypothetical players who both have a .250 batting average.
Player A is a shortstop who also contributes defensively. Player B is a designated hitter whose main responsibility is hitting.
Their identical batting averages do not mean they provide the same overall value. Player A may contribute through both hitting and fielding, while Player B’s offensive production needs to be evaluated through additional batting statistics.
Where Can You Find Baseball Statistics?
Several websites provide statistics for current MLB players, teams, and historical seasons.
The official MLB statistics page provides current player and team numbers. You can check batting records, pitching performance, and season leaders.
Baseball-Reference offers historical records, player profiles, season statistics, and career comparisons. It is useful when researching players from different generations.
FanGraphs provides advanced baseball statistics, player analysis, and sabermetric data. It is especially helpful when learning about WAR, wOBA, and other advanced measurements.
Beginners can start with MLB.com and gradually use the other websites as they become comfortable with more detailed statistics.
Frequently Asked Questions
What does a batting average of 1.000 mean?
A 1.000 batting average means a player has recorded a hit in every official at-bat. For example, a player who gets three hits in three at-bats has a 1.000 average. It is possible over a small number of at-bats but extremely difficult to maintain over a full season.
What is the difference between a baseball stat and a box score?
A baseball statistic measures a specific aspect of performance, such as hits, runs, or strikeouts. A box score summarizes an individual game and displays team results alongside player statistics. It provides a quick record of what happened during that matchup.
Do baseball statistics reset every season?
Season statistics begin again at zero when a new regular season starts. However, career statistics continue to accumulate throughout a player’s professional career. Baseball websites often display both figures separately.
Has any MLB player hit five home runs in one game?
No MLB player has recorded five home runs in a single game. Four home runs is the MLB single-game record. Several players have achieved this feat, including Kyle Schwarber, Nick Kurtz, and Eugenio Suárez in 2025.
Are baseball statistics the same in the regular season and playoffs?
No. MLB records regular-season and postseason statistics separately. A player’s postseason performance does not get added to their regular-season totals. This distinction allows fans and analysts to evaluate performance in each competition separately.
Final Thoughts
Understanding baseball stats does not have to be overwhelming for new fans. Start with basic numbers like batting average, ERA, home runs, and stolen bases. Then gradually learn about fielding percentage, WAR, and other advanced measurements.
You do not need to memorize every formula to enjoy baseball. The important thing is knowing what each statistic measures and how different numbers work together. They tell stories about players, teams, and individual games, making the sport easier to follow.
Pull up a player’s page during your next game and see how the numbers explain what happens on the field.